
This post was originally published on this site
Bubbles always implode. – Charles P. Kindleberger, Manias, Panics, and Crashes: A History of Financial Crises

Artificial intelligence has helped drive stocks and earnings sharply higher, raising fears of an AI stock market bubble. A closer look at valuations, profits, and the lessons of the dot-com era suggests today’s market may be expensive without being irrational.
Getty
With US large-cap stocks up almost 114% since the end of 2022, equivalent to over 22% annualized and well above the long-term historical return of 10%, investors may ask whether this is an artificial intelligence (AI)-driven stock market bubble. The case gets even more interesting when you look at the technology sector’s nearly 250% total return over the same period, which equates to a whopping 39% annualized return. This article will explore whether investors should fear that markets have entered an unsustainable bubble.
What is a Bubble?
High returns and expensive valuations are necessary but not sufficient conditions to call something a bubble. A bubble is defined as valuations that, after accounting for cash flow, growth, and competitive assumptions, are sufficiently implausible. This implausibility makes a sizable price decline likely, or, in Kindleberger’s words, “Bubbles always implode.” Let’s look at the evidence.
Valuation
While the S&P 500 has returned almost 20% year-to-date, the price-to-earnings (P/E) ratio, the cost per dollar of earnings, based on expected 2026 corporate earnings, has fallen. How is that possible? The answer is that S&P 500 earnings are expected to grow 32.4% in 2026, according to FactSet consensus estimates.
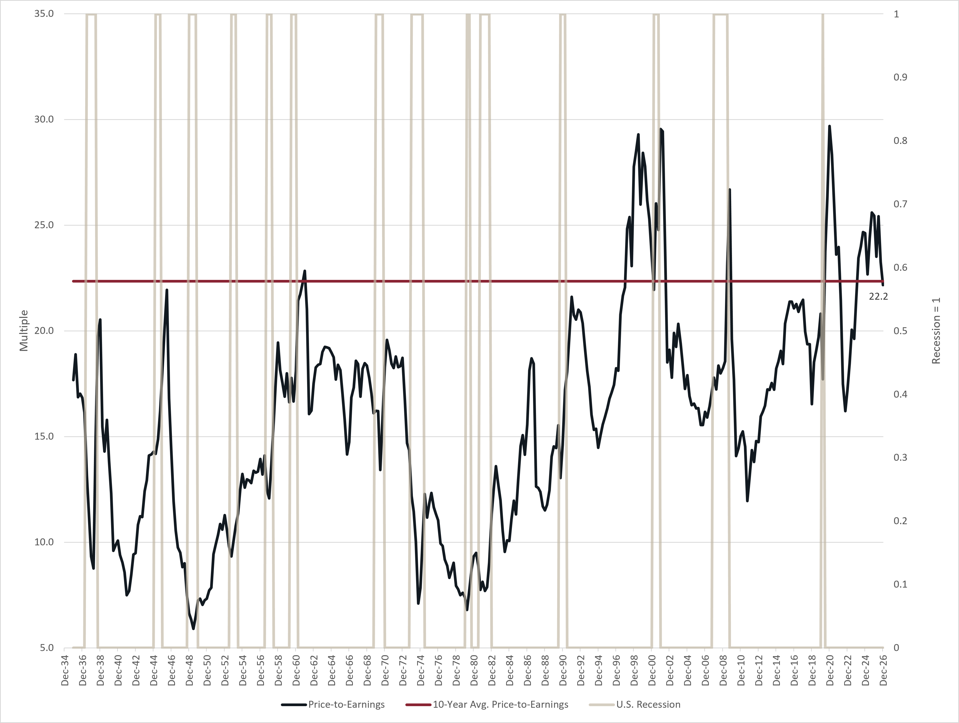
S&P 500 Price-to-Earnings Multiple
Glenview Trust, Strategas, Bloomberg
When looking at the long-term history of P/E ratios, the current 22.2 times is not cheap, but it is essentially back at its 10-year average. It pays to remember that there are two ways a seemingly expensive asset can get cheaper: 1) the price of the asset can fall or 2) the earnings or cash flow produced from the asset can grow quickly enough to shrink the valuation.
Cyclically Adjusted Price-Earnings (CAPE) Ratio
We favor the figures of average earnings covering between five and ten years. – Benjamin Graham and David L. Dodd, Security Analysis, 2nd edition, 1940
While it has long been a common idea among professional security analysts to average several years of earnings to estimate a company’s normalized earnings power through an economic cycle, a paper in 1998 by John Campbell and Robert Shiller popularized the CAPE ratio for investors to judge the outlook for future stock returns based on this valuation. In theory, CAPE uses a rolling 10-year average of inflation-adjusted earnings to reduce cyclical noise and produces a more stable estimate of underlying corporate profitability.
Fed Chair Alan Greenspan did not explicitly cite the CAPE ratio in his 1996 ‘irrational exuberance’ speech. Still, the speech occurred as Robert Shiller’s research on valuation ratios was becoming increasingly influential. The association grew after Shiller’s book Irrational Exuberance used CAPE to argue that equity valuations had reached historically extreme levels.
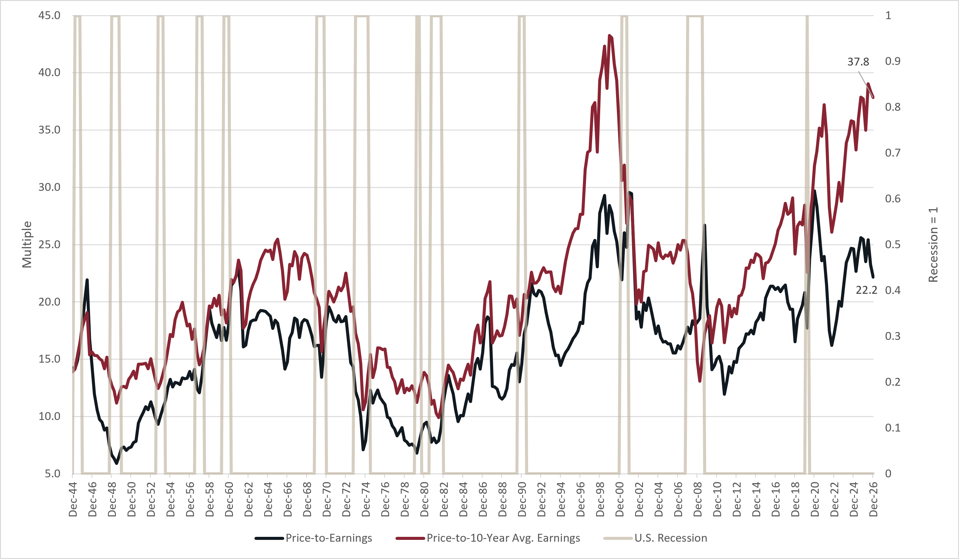
CAPE Ratio
Glenview Trust, Strategas, Bloomberg
Shiller published Irrational Exuberance on March 15, 2000, almost exactly at the peak of the dot-com bubble. The S&P 500 peaked on March 24, 2000, then fell 49.2% before bottoming on October 9, 2002. The dot-com-heavy NASDAQ index faced a far worse fate, declining 77.6% from its March 10, 2000 high to its October 9, 2002 low.
There are three primary takeaways from this period:
- The dot-com period was a bubble, as stock prices rose well beyond reasonable earnings assumptions.
- Valuation is a very inaccurate tool for timing. The dot-com-heavy NASDAQ index rose 288% from Greenspan’s 1996 speech until its March 2000 peak.
- The CAPE ratio’s popularity as a stock market indicator soared given the timing of Shiller’s book.
CAPE Today
The CAPE ratio today suggests a significantly overvalued stock market, and perhaps an AI stock market bubble. Still, it has produced almost constant false alarms since we passed the Global Financial Crisis. A 2026 paper by Dino Palazzo examined why the CAPE ratio, despite its continued popularity, has failed as an indicator.
Palazzo found that post-1995 reported earnings are less comparable to historical earnings. Palazzo traces the structural break, a higher CAPE ratio starting in 1995, to two accounting changes that affected earnings.
R&D and intangible investment
FASB Statement No. 2 required companies to expense internally generated R&D immediately. Economically, much of R&D is an investment intended to produce benefits over multiple years. As R&D intensity rises, current GAAP earnings absorb the full expenditure, while historical tangible-capital businesses capitalized substantial investment and recognized it gradually through depreciation. Palazzo finds this is the dominant source of earnings mismatch and CAPE level shift.
Special items and impairment accounting
SFAS 121 and related changes encouraged faster and more frequent recognition of impairments and restructuring losses. Accounting is asymmetric: impaired assets are written down, but internally regenerated value is generally not written back up. Special items are heavily concentrated in downturns. A single recession-era charge remains in CAPE’s denominator for ten years, so averaging does not remove the distortion. Palazzo finds special items had a smaller impact but added substantial cyclical volatility.
Palazzo’s adjusted CAPE suggests valuations remain elevated but resemble prior long technology and productivity cycles rather than a wholly unprecedented regime. While the paper doesn’t state this directly, it’s fair to interpret his adjustments as suggesting AI hasn’t caused a stock bubble.
Dot-Com Bubble Comparison
With the market so concentrated, over 40% of the S&P 500’s market capitalization weight sits in the top 10 largest companies, it is notable that the 12-month forward estimated price-to-earnings ratio is well below the 2000 tech bubble level. While this does not prove the absence of a bubble, it is strong evidence to the contrary. Further, 29 times earnings is not inexpensive.
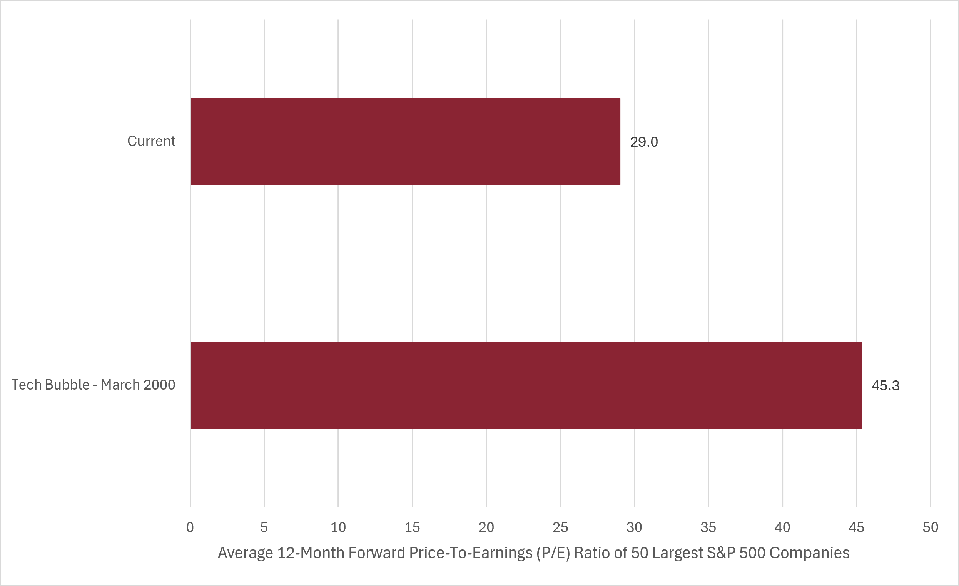
Average P/E Multiple
Glenview Trust, Strategas
Growth Matters
Over the long term, it’s hard for a stock to earn a much better return than the business which underlies it earns. – Charlie Munger, Poor Charlie’s Almanack
As noted previously, one way a seemingly expensive asset can earn its valuation is by growing earnings faster. The current AI-driven earnings boom, also evident in the communication services sector via Meta Platforms (META) and Alphabet (GOOG, GOOGL), is still expected to drive above-average S&P 500 earnings growth through 2027.
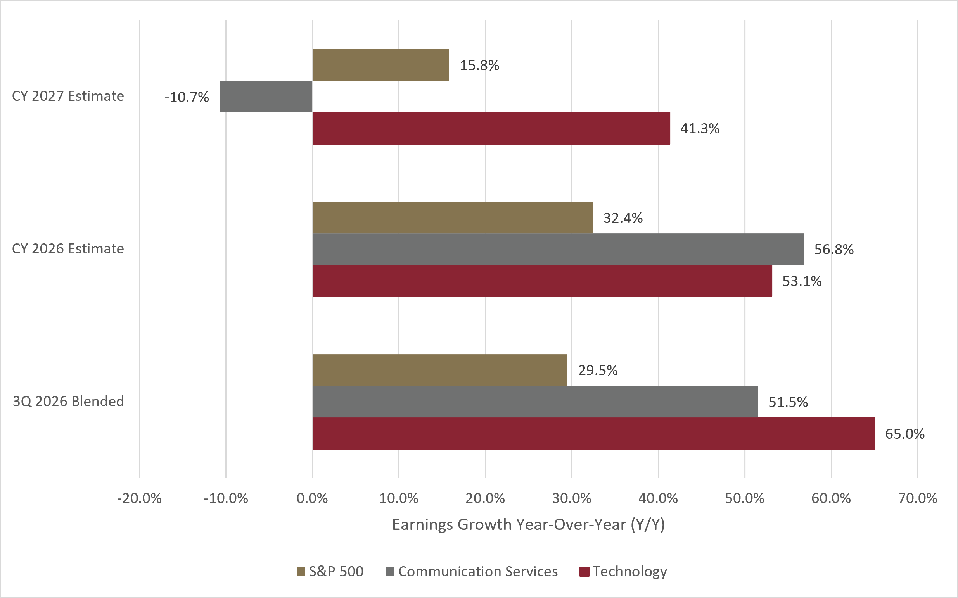
Key Earnings Driver: Technology
Glenview Trust, FactSet
If these attractive earnings growth rates materialize, the S&P 500’s valuation becomes much more attractive. Further, the S&P 500’s return on capital, as measured by return on equity (ROE), has been rising and is expected to continue improving. All else equal, investors should be willing to pay a higher multiple for a stock market that delivers higher returns on capital for shareholders.
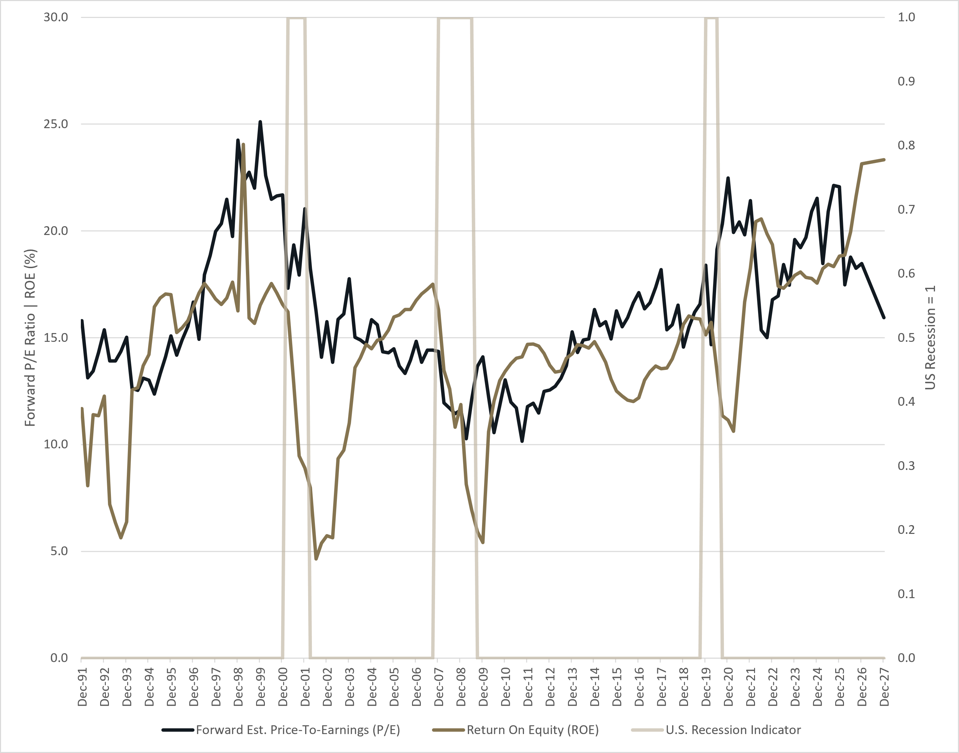
Valuation: Return on Capital
Glenview Trust, Bloomberg
As with the higher S&P 500 earnings growth rate, all roads lead back to technology. Technology companies’ profitability has been improving and has been a primary driver of the S&P 500’s overall profitability improvement.
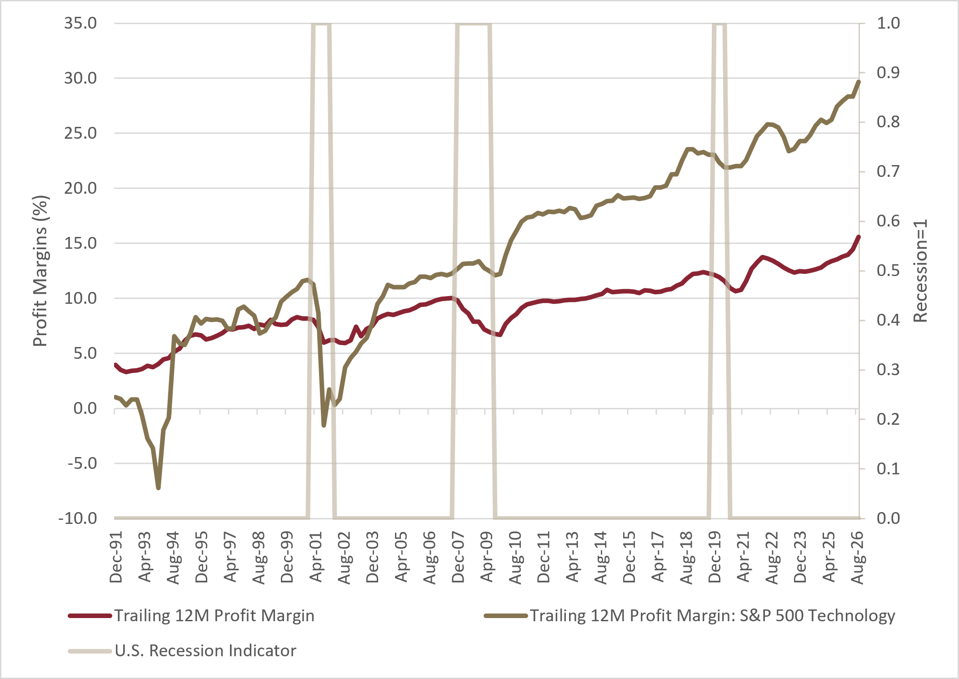
Profitability
Glenview Trust, Bloomberg
Overearning?
Historical earnings growth rates also support the view that this is not an AI-driven stock market bubble.
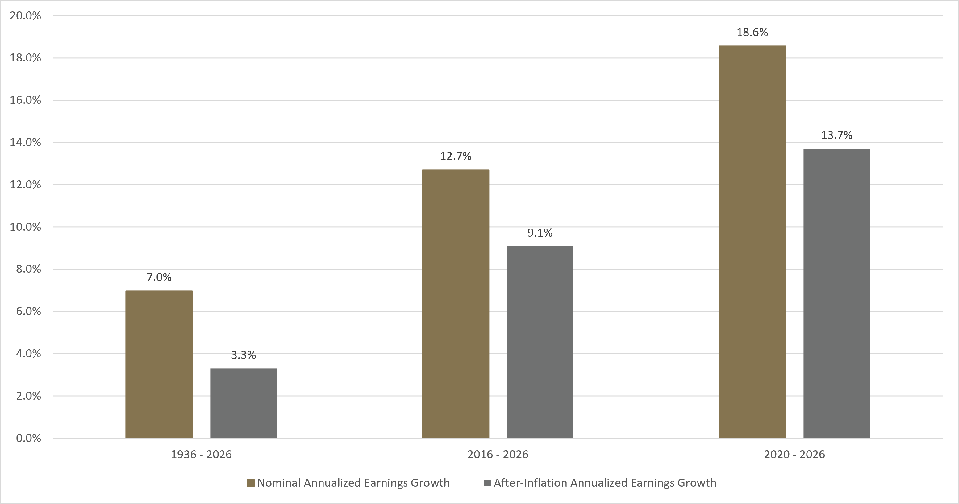
S&P 500 Earnings Growth Rates
Glenview Trust, Strategas, Bloomberg
There remains a legitimate concern about some companies’ earnings running well above their normalized levels, or, in short, overearning. Goldman Sachs expects US AI hyperscalers to spend $800 billion in 2026 and $1.1 trillion in 2027 on capital expenditures to build out AI capacity. For example, this unrelenting AI demand has almost certainly driven earnings for some semiconductor and memory chip producers well above normalized levels. The harder part is knowing when the shortages causing the excess earnings will end. So far, demand growth and AI utilization growth remain intact.
Conclusions
While stocks are clearly not cheap on the surface, their robust fundamentals are not consistent with a stock market bubble. Unlike the 2000s dot-com bubble, current valuations are plausible if the better-than-normal corporate profitability continues. This is a rare instance where the present differs from the past. The dominance of some technology leaders, often across their respective ecosystems at massive scale, keeps earnings power elevated above historical norms. This presupposes that this dominance can last, but right now that looks like the base case.
Stocks are pricing in a pretty rosy outlook, with ROE expected to remain above pre-2021, pre-AI technology-boom norms. Even without a stock bubble, disappointment would likely still lead to stock market declines. Investors should continue to monitor AI-related demand growth and pay particular attention to companies currently overearning, as watching for the turning point is more crucial for this group.
© 2026 Forbes Media LLC. All Rights Reserved
This Forbes article was legally licensed through AdvisorStream.